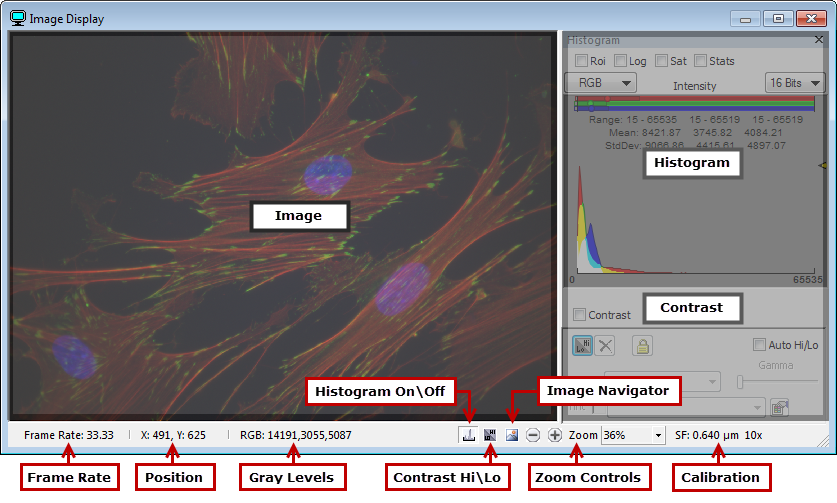
The Image Display provides feedback from live and captured images and is essential for setting up and adjusting devices and lighting conditions. The window can be hidden or shown using the Toggle Image Display button (![]() ) in the Main Toolbar. The Display Image selection drop-down determines the image to be displayed during a multi-channel monochrome sequence and may be changed at any time for immediate visual feedback. Up to five images can be defined in the Capture Pane.
) in the Main Toolbar. The Display Image selection drop-down determines the image to be displayed during a multi-channel monochrome sequence and may be changed at any time for immediate visual feedback. Up to five images can be defined in the Capture Pane.

The Image Display does more than just display a live image, it provides feedback about the acquisition and access to tools for optimizing the image being displayed. The Status Bar, located at the bottom of the window, displays acquisition details and includes:
Note: When using the ORCA-Flash4.0 series and the ImagEM X2, the pixel values displayed in the status bar are reported in gray levels and electrons. This feature is only available when using the ORCA-Flash4.0 series and the ImagEM X2.
The Image Navigator is a separate window that displays the entire active image and allows users to navigate to and zoom in on particular areas of the image. A zoom preview box indicates the area of the image currently being displayed in the image display. Drag the box to pan across to other areas of the image. Use the mouse scroll wheel, the plus (+) and minus (-) keys or the zoom controls to increase or decrease the magnification. The zoom preview box will adjust accordingly to reflect changes in magnification. For more information on this topic, see "Image Navigator."
The Histogram Display shows the current intensity distribution for an image. In the case of RGB color images, multiple histograms are overlaid, one for each color. Areas where the histograms overlap are represented by the resultant color (i.e., red + green = yellow, red + blue = magenta and green + blue = cyan). The histogram reflects the bit depth of the image, a 16-bit image for example, consists of 65,535 possible intensity values. Statistics including: the range, mean and standard deviation are display above the histogram and may be displayed in a separate window by enabling Stats. The Histogram display may toggled on or off from the Status Bar. For more information on this topic, see "Histogram."