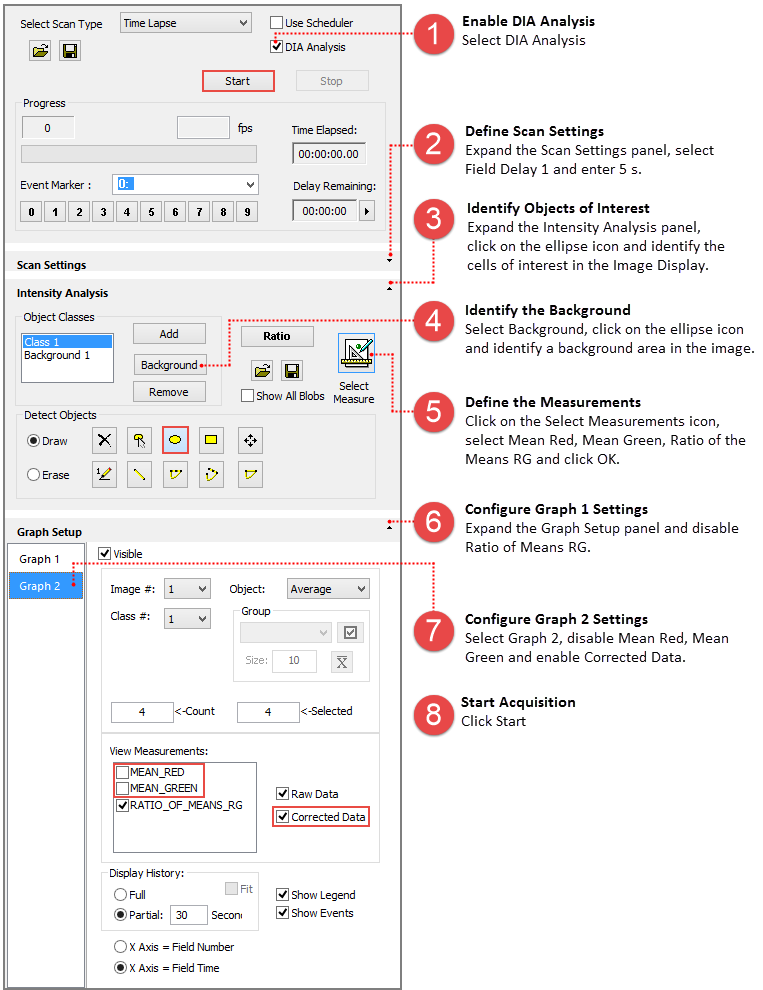
DIA Analysis can be run live, in real time, as well as on previously acquired data sets. The following examples provide instructions for various situations.
The instructions below outline the steps for setting up a basic DIA Analysis experiment with a single class of objects and background correction. Configure the capture settings as needed for your sample. Two channel, Red and Green settings were used for this example.

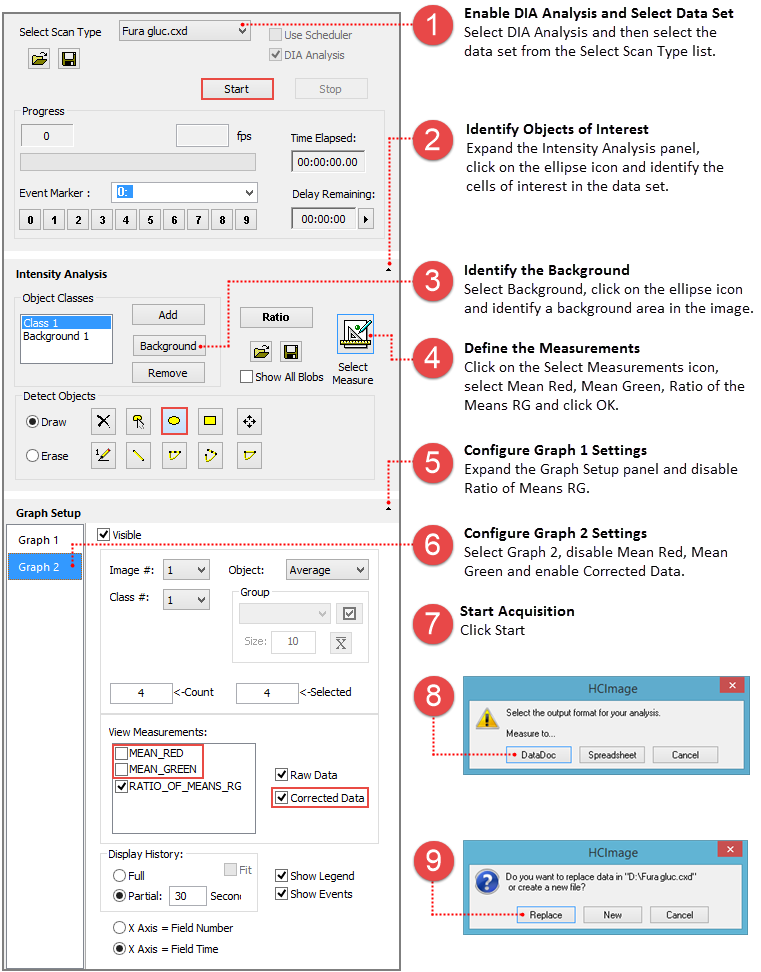
DIA Analysis can be run on previously acquired image sequences. The example below includes a single class of objects with background subtraction. Open the data document to analyze, go to the Sequence pane and follow the instructions below.
Note: In addition to data documents (cxd), DIA Analysis can run directly from multi-page tiff and dcimg files.
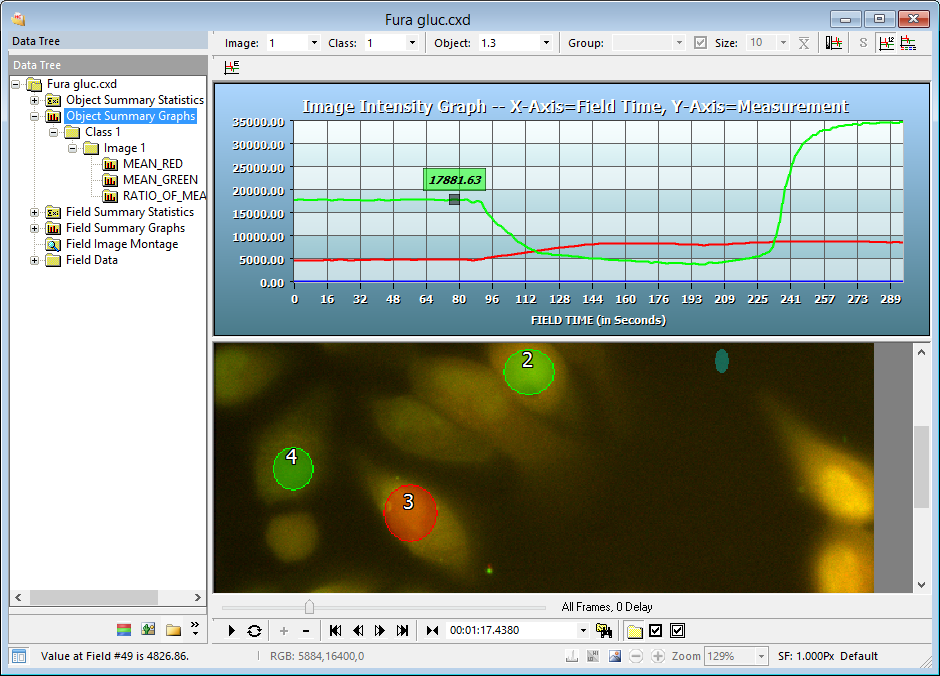
When the analysis is complete the data document will open and display the Object Summary Graphs. The graph is interactive, click on one of the lines and the image and corresponding object are display below for the selected time point. Select an object from the image to display its data in the graph above. The Object Summary Graphs toolbar provides a variety of options for organizing the data in the graph.
The diagram below provides a partial timeline of the experiment. Each component is broken down and plotted as interval time (red line), with the individual intervals labeled by action. Components are grouped into scans (purple line) and labeled by type. This example provides instructions for creating the schedule and defining the scans, identifying objects of interest, selecting measurement and graph setup have already been covered and are not included in the DIA Scheduler example.

The schedule for the experiment consists of four scans, the scans are defined below:
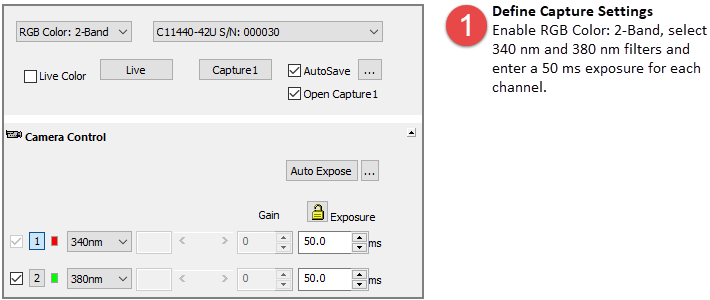
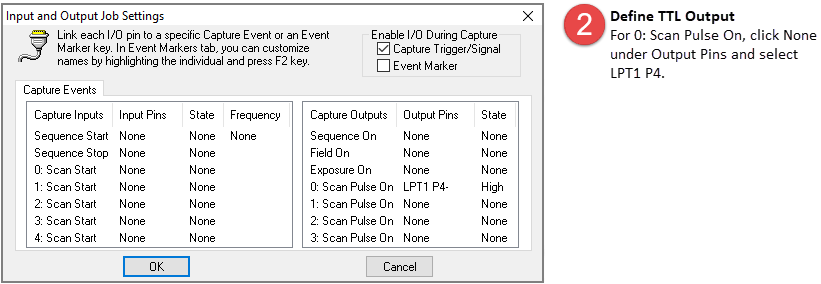
Before setting up the scans we need to enter the capture settings and configure the TTL settings for triggering pulses. For this example, the light source is controlled using TTL, where pin 2 (340 nm), pin 3 (380 nm), and pin 4 (500 nm).
Click the I/O Setup button in the Devices pane, the TTL trigger outputs are identified as Scan Pulse On, 0-3. If the I/O Setup button is not visible you will need to add an I/O device in the Profile.
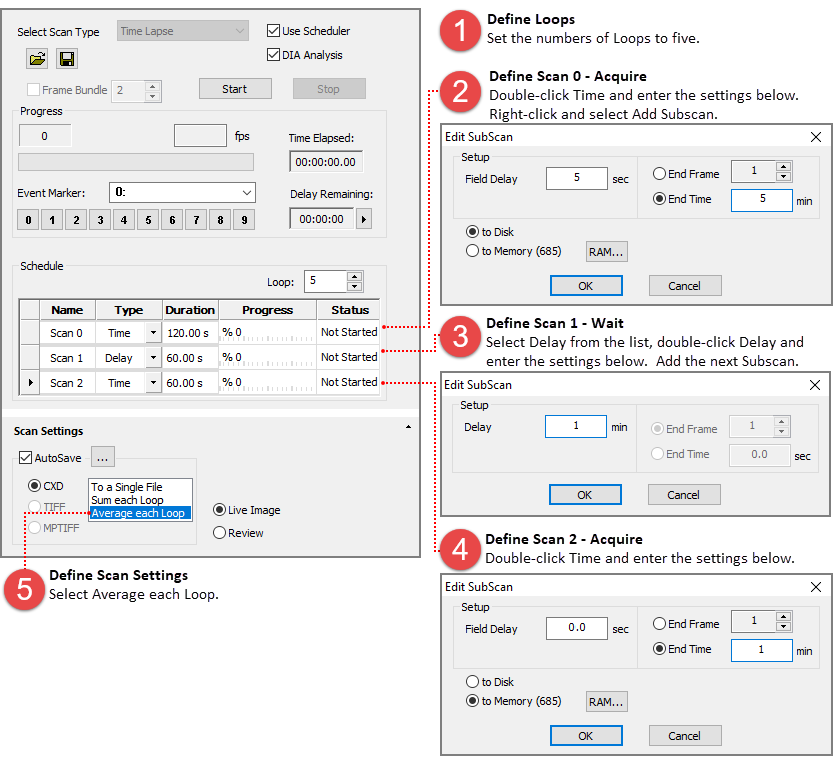
Go to the Sequence pane, select Use Scheduler and DIA Analysis and follow the instructions below.
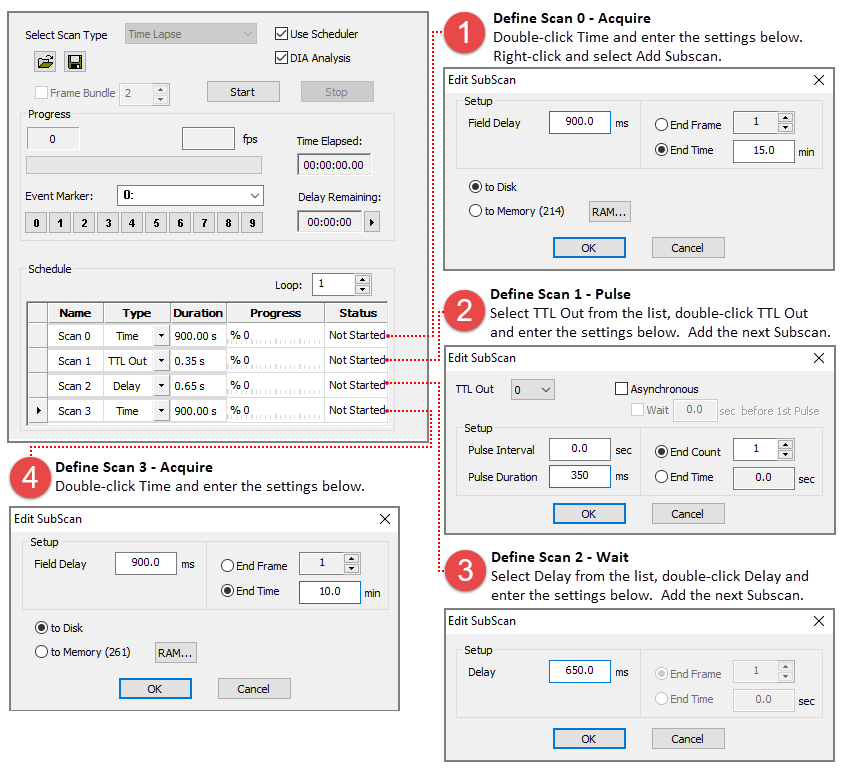
This example provides instructions for defining the scans, identifying objects of interest, selecting measurement and graph setup have already been covered and are not included in the DIA Scheduler example.
Go to the Sequence pane, select Use Scheduler and DIA Analysis and follow the instructions below.
