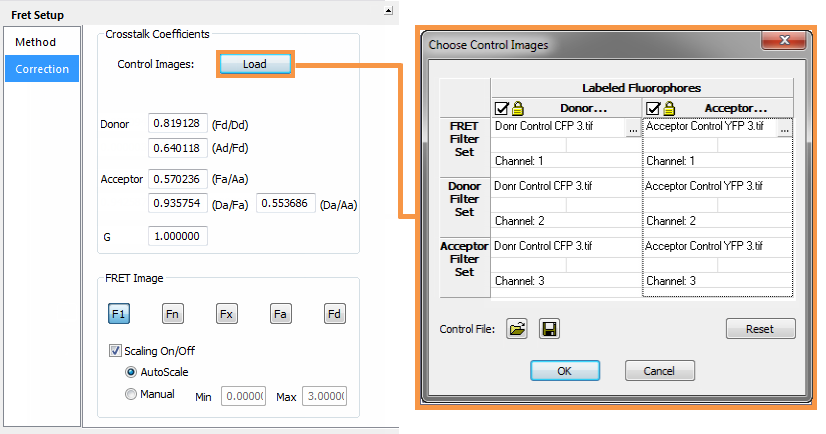
The second step determines the source of the image channels necessary for performing the calculations and calculates the Crosstalk Coefficients. Select Correction from the FRET Setup panel (shown below) and click Load.

Typically, the target FRET image is normally the open document and automatically entered into the image selection list, so only the control images need to be selected. If you are manually entering known crosstalk coefficients to calculate your FRET correction, no control images are necessary.
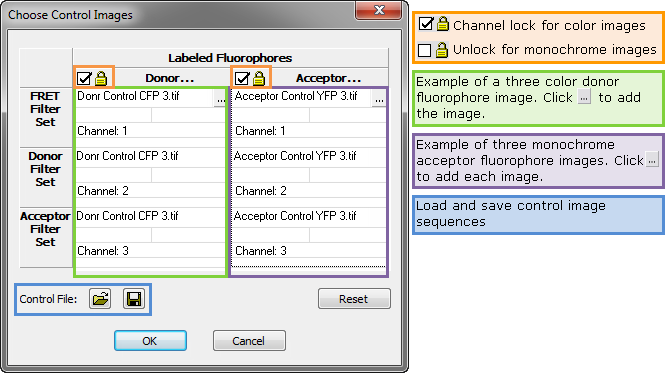
FRET images can be selected individually or grouped by fluorophore. You can load three individual monochrome images for the FRET labeled specimen or you can load one three-color image where each component is representative of a filter set (i.e., Red - FRET filter set, Green - Donor filter set, Blue - Acceptor filter set).
To select the control images click the Load button in the FRET Setup panel.

To load a three-color image, make sure the Locked option is checked for that fluorophore. Click the [...] button to select the image. To load individual monochrome images separately, uncheck the Locked option and there is a [...] button for each component.
For an experiment, the same control images may be used if the capture settings are kept constant. When the control images are fully loaded, use the Save button to save both the donor and acceptor control image sets to a data document. Click the Open button in the Choose Control Images dialog to load the control file.
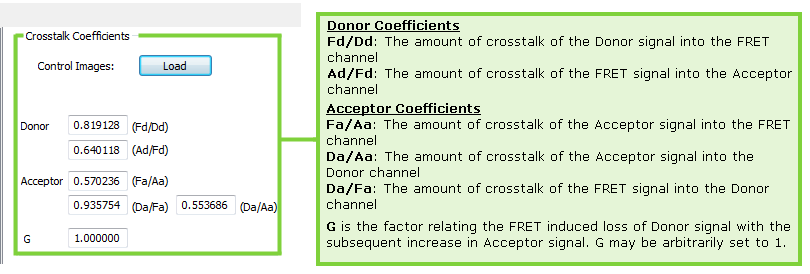
The Crosstalk Coefficients are automatically calculated from the selected control images. Known Crosstalk Coefficients can be entered manually if correction images are not available, or if the values can reliably re-used rather than re-calculated.

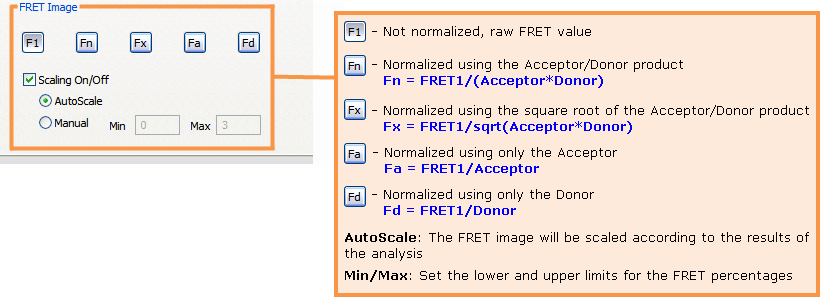
The raw and normalized FRET data will be calculated and reported in the data document. Select one of the FRET image buttons to display the raw or normalized image in the data document.

The Min and Max scaling values can be used to control the range of intensities displayed, allowing flexibility in highlighting a specific range of FRET values in the image. You can enter these values manually or select AutoScale and these values will be calculated for you.