Open topic with navigation
Motion Tracking
This section covers some of the specifics for determining parameters to start the tracking algorithm, as well as options for viewing the tracks and the reported objects, with track measurements and statistics.
Tracking Parameters
A measure of how objects compare to the last field of measured information. The parameters are measures of time and size (i.e., Speed and Area).
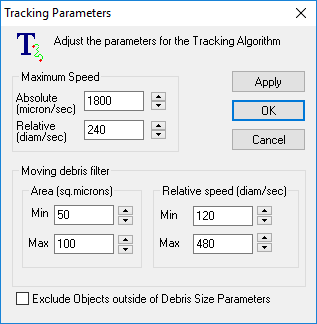
Maximum Speed Values
In the Maximum Speed window there are two settings that allow the user to enter the distance that objects move from field to field. The values used affect the search zone for field to field tracking:
The Absolute Maximum Speed is a setting in calibrated units that is applied to all objects equally. The user may predict a distance that objects move between fields (often based on the largest object). For example, if it is observed that the largest object is moving approximately 400 microns per field, then an absolute value of 500 microns could be selected to define a search zone. The defined search zone will be applied to each object equally. This value may be adjusted to suit variations in field to field movement.
The Relative Maximum Speed is a factor applied to each object that is multiplied by the objects size; therefore each object will have its own unique search zone. The user inserts a factor that multiplies each object diameter to create a search zone to match the distance that objects move between fields. For example if a factor of 150 is used and an object has an area of 10 microns, then a search zone of 1,500 microns will be defined. This value may be adjusted to suit variations in movement.
Moving Debris Filter Values
Minimum Area - Objects below this number will have more stringent requirements when determining whether a matching object is found. (Two objects will need to be closer in size for a track to occur)
Maximum Area - Objects above this number will most likely be mapped to each other.
Tracking Menu
Use the Tracking menu to limit the field of view or display object properties such as center of gravity and absolute and relative speed.
The following tracking functions are available through the Track Image sequence drop down menu.
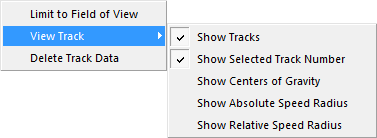
Limit to Field of View
Only Show Tracks existing in the current field.
Track Viewing
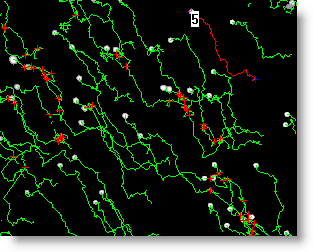
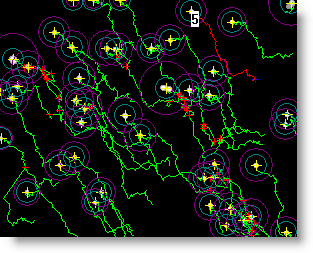
Select the object and track information to display on the image. The objects tracks are green and highlighted red when selected. The pink cross (+) identifies the starting point and the blue cross identifies the end point. Possible collisions are represented by red crosses (+) and a yellow track indicates that the track can not be linked to a single object. This occurs when two or more objects collide or intersect and the resulting tracks could not be associated with a specific object.
- Show Tracks - displays the object tracks in green
- Show Selected Track Number - displays the object track number when a track is selected
- Show Centers of Gravity - displays a yellow cross on the object's center of gravity
- Show Absolute Speed Radius - is identified by a blue circle
- Show Relative Speed Radius - is identified by a purple circle
Track Statistics
The Object and Track Properties dialog reports the object's current position, size and intensity as well as distance velocity and direction measurements.
Double-Click on a Track to see its individual properties and statistics. In the Object and Track Properties dialog there are two lines drawn to represent the track. The red line connects the position of the object at each point in the track. This is the actual path of the object along the track. Measurements based on this path are called Curvilinear measurements denoted by cl.
The blue line represents a curve fitted through each point on the track to generate a mean path for the track. Measurements based on this path are called Mean Path measurements denoted by avg.
The start and end point of the track are used to generate a straight line representing the final distance traveled for the object. This line is not drawn. Measurements based on this path are called Straight Line measurements denoted by sl.
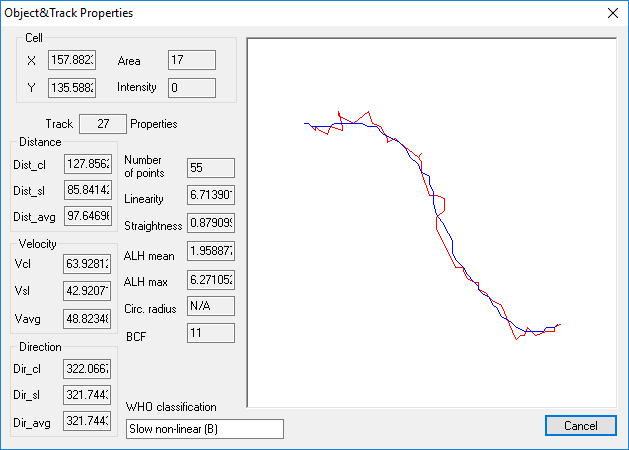
Cell
The Cell reports the object's current position, area and intensity. As the object travels along the track these values will change. To view a complete list of the object area, position and intensity along each track, click Summary Track Graph and select the Table or Spreadsheet View.
- Position - the object's current X, Y coordinates
- Area - the area of the object in pixels
- Intensity - the average intensity of the object
Distance
The length of the line in calibrated units (e.g. Microns).
- Dist_cl (Curvilinear Distance) - The actual distance traveled by the object.
- Dist_sl (Straight line Distance) - The shortest distance from end to end.
- Dist_avg (Mean Path Distance) - The average distance traveled by the object.
Velocity
The average speed of the object along the track (distance/time taken).
- Vcl (Curvilinear Velocity) - The velocity of the object along the track.
- Vsl (Straight Line Velocity) - The velocity of the object along the a straight line path from end to end.
- Vavg (Mean Path Velocity) - The velocity of the object traveling along the mean path.
Direction
The direction of movement of the object is the angle measured from 0-360 degrees.
- Dir_cl (Curvilinear Direction)
- Dir_sl (Straight Line Direction)
- Dir_avg (Average Direction)
Number of Points
The number of consecutive images containing the same object used to make up the track.
Linearity
A factor indicating how close the track is to a straight line. The maximum value is 10 for a perfectly straight line.
Straightness
The fractional ratio between the straight line path and the mean path. The Maximum value is 1.0 for a perfectly straight line.
ALH Mean
The ALH mean is determined by adding the amplitudes of the track at each point and dividing by the number of points in the track. The amplitude is the distance from the actual track and the mean path. Mean Amplitude of the transitions either side of the mean path. This calculation is useful for subjects having a regular beating motion (e.g., sperm). A higher value indicates the subject move vigorously away from the center line.
ALH Max
Maximum Amplitude of the transitions either side of the mean path for straight tracks as it tends to infinity. Also the value may not be useful when the direction of curvature of the mean path changes for the object.
Circular Radius
The computed radius constraining the circular motion of a subject. Note this value cannot be computed for straight tracks as it tends to infinity. Also the value may not be useful when the direction of curvature of the mean path changes for the object.
Beat Cross Frequency
The BCF is calculated from the number of times the track crosses the mean path. It gives another indication of subject motility when applied to samples with a regular beating motion.
WHO Classification
The World Heath Organization classification scheme:
- Rapid Linear (A) - subject makes significant direct forward motion. High Vsl and High Straightness.
- Slow Non-Linear (B) - subject makes motion, but moderate Vsl. High Vsl and low straightness.
- Non-Progressive Motile (C) - subject makes some motion, but no progress low Vsl.
- Non-Motile (D) - subject makes insignificant motion low Vavg.
- Unclassified (U) - insufficient information.
![]()


