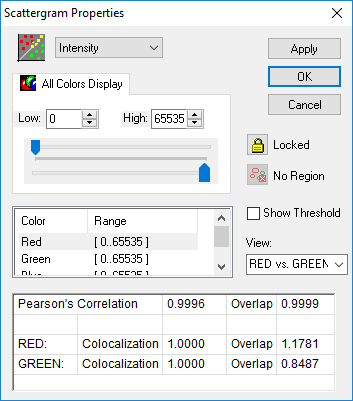
Image Intensity data can be displayed as a frequency distribution for one of more color components in an image providing information on the contrast and dynamic range properties of the image. The Image Scattergram allows Image Intensity information to be correlated for two color components at once. The example below shows the original image and the correlation of the intensity values in one-color channel vs. the intensities in another color channel. The corresponding source color channel icons are located below each scattergram.

