 ) located in the status bar.
 The SideBar unifies all of the information stored in a data document for viewing or export. There are three options for navigating through the stored data: the Data Tree (![]() ), Image Thumbnails (
), Image Thumbnails (![]() ) and Merge (
) and Merge (![]() ). Click on an icon, at the bottom of the SideBar, to select the navigation interface. The Sidebar is located on the left side of the data document and can be hidden by clicking the Toggle SideBar icon (
). Click on an icon, at the bottom of the SideBar, to select the navigation interface. The Sidebar is located on the left side of the data document and can be hidden by clicking the Toggle SideBar icon ( ) located in the status bar.
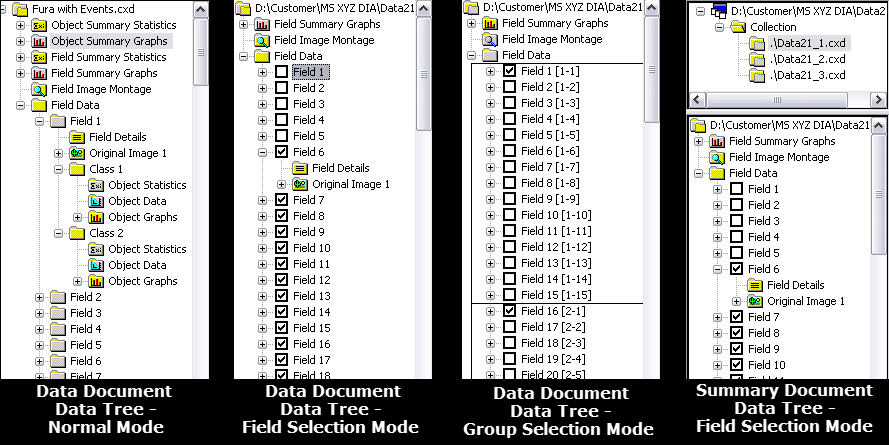
The Data Tree contains a number of nodes, each of which may contain either data or other nodes. This structure maintains the relationships of data as it is collected in a database like format, allowing the data to be reconstructed and reviewed after it has been saved. This can be a significant benefit over saving data in a spreadsheet format, as once data is saved to an unstructured file it can be very difficult to reconstruct for useful analysis.
The behavior of the Tree nodes follows the Windows conventions. To expand a node, click on the (+) sign, to contract a node, click on the (–) sign. To select an item, click on the name of the item to display its data in the View pane.

The uppermost (Root) node shows the name of the Data Document file. This node displays a text view where capture settings are automatically stored. Nodes under the Root Node are Summary nodes for Measurement Statistics and Graphs, and the detailed data containing Field and Object Measurement Data for each Field in the Data Document.
Measurements in each Field are divided into Classes. A new Class begins each time a Measure Icon is included, signifying that a new set of measurement data is to be collected. Field and Object measurement data is collected separately for each Measurement Class.
The combination of measurements from different classes is possible using Custom Measurements. The Custom Measurements Menu provides a button to select a measurement from a particular Class number. This makes it possible to arithmetically combine measurements for comparison, e.g., in percentage ratios, or for subtracting background values.
Image Thumbnails are small graphics that represent the original images stored in the data document. Thumbnails are organized in the order that they were acquired, the field number is displayed below each thumbnail. Select a thumbnail to display the corresponding image.
Merge mode is used for overlaying images using drag and drop. Merge mode must be enabled in order to drag and drop thumbnails. The process is easy, select a source and then drag and drop the thumbnails of other images on to the source overlay thumbnail. For color images, the source image component is replaced with the new image, see Color Images below for a description of merging color images. For monochrome images, the new image is added as an overlay channel, see Monochrome Images below for a description of merging monochrome images. Adjust the contrast for the individual overlay channels, right-click on the thumbnail and select Contrast. Make adjustments using the sliders in the Display Contrast dialog. Click the Split Channel icon (), located in the top left corner of the SideBar, to enable viewing of the individual overlay channels. When Split Channel mode is enabled, click on a thumbnail to display the corresponding overlay channel. Click the Split Channel icon to view the merged image. To turn merge on/off, right-click on a thumbnail and select Merge On or click the Apply Merged Display icon (
) in the Display toolbar. For more information on merging images, see "Merged Display."
When merge mode is enabled, individual thumbnails for the red, green and blue overlay channels are displayed for color images. Dragging and dropping a thumbnail into an overlay channel will replace the existing overlay channel thumbnail, the corresponding color component of the image will be updated. The new overlay thumbnail will reflect the name of the image, not the red, green or blue color component of the original image.
When merge mode is enabled, drag and drop the thumbnails of the other images on to the thumbnail of the source image. The merged image is displayed along with thumbnails of each of the overlay channels. A total of 10 images (1 source and 9 overlay images) can be overlaid. Apply color to an image, right-click on a thumbnail and select a tint from the Tint drop-down menu. Repeat the process for each image. Adjust the contrast for the individual overlay channels, right-click on the thumbnail and select Contrast. Make adjustments using the sliders in the Display Contrast dialog. For a step-by-step instruction, see "How to Merge Several Monochrome Images."