Open topic with navigation
Image Document Overview
Image Documents contain data from a single image that has been acquired from a capture device or loaded from a disk. The Image Document provides a variety of options for viewing image data. Quickly switch from the captured image to multiple graphical formats to a spreadsheet using the Image Data View Toolbar.

Image Zoom and Window Control  See More
Image display controls for zooming the Image Document. The original image data is not modified and is provided for a visual display zoom only.

|
Normal Zoom (1X) |
View the image in its original size (1X magnification or 100% Zoom) This is especially important for images where there are fine lines that may not be visible due to sub-sampling when a low zoom factor is used. ( HOTKEY " * ") |

|
Fit Window to Image |
This option resizes the image document window to fit the current image. |
The Region button allows a rectangular portion of the image to be identified and displayed or hidden independently from other image layers. Click on the Region to select it, highlighting the Region shape. Move the selected Region by dragging it with the cursor. To modify the size and shape of the Image Region, select the Region shape by clicking on it, then click and drag the corner or side handles.

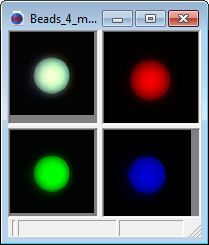
Use the Quadrant View button to automatically create a four-pane quadrant view of the image. The image is separated into it's color components by default. Each view has independent Image Document viewing controls, making it possible to view the image as an overview at zoomed magnification or with any of the other transforms applied at the same time. As multiple Image Document views are created simultaneously, memory usage for large images can be significant. The center of the quadrant view can be moved to provide different sized views by clicking and dragging the central quadrant frame. Clicking in each pane selects that pane as current, and displays the toolbars and settings for that pane.


|
Quadrant View |
Automatically creates a four-pane quadrant view of the image, by default separating the color components using the Display Color Components |

|
RGB Split
|
Automatically sets the Display Color Components to All Colors, Red, Green, Blue for the respective quadrants. If it isn't, each quadrant is displayed using All Color Components.
|

|
Copy To Montage
|
Creates a new Image Document containing all four views in a single image as a 2x2 montage. This can then be treated as a single image for further operations, like saving to disk or printing.
|

|
Fit All Images to Window
|
Resizes each image pane to fit within the border of its frame (excluding scroll bars). Use this in conjunction with the Fit Window to Image option to create a display like the example with convenient framing of each equal sized pane.
|

|
Reset
|
Clears all settings and memory associated with the Quadrants.
|
Use the drop menu to switch the normal image to the Graph View, Spreadsheet View, Table View and Histogram Views.

|
Image View |
Is the normal method of viewing image data as an intensity bitmap, or picture. |

|
Graph View |
Displays a 2-Dimensional Profile View of the image. The graph shows the image pixel positions in the XY axes with the pixel intensity data represented by color. Right-click and select View 3-D Graph to displays a 3-Dimensional Intensity Profile of the image.
For more information on the Graph View, see "Graph View ." |

|
Spreadsheet View |
Displays Image Document Data pixel intensity in a spreadsheet. This allows for a close inspection of image data values. Image data in a column, row or region of the spreadsheet can be copied to the clipboard and pasted into a spreadsheet or report application. |

|
Table View |
Reports Image Document Data pixel intensity in a Table View allowing close inspection of image data values. In the Table View, histogram data can be sorted in any column in either increasing or decreasing order by clicking on the column header. It can also be copied to an external spreadsheet, via the "Edit>>Copy to Spreadsheet" and "Edit>>Copy to Excel™"
|

|
Histogram View |
Displays a 2-Dimensional Intensity Histogram which describes how many pixels are contained within the image document within various intensity-level ranges. Right-click and select View 3-D Graph to displays a 3-Dimensional Intensity Histogram of the image.
For more information on the Histogram View, see "Histogram View." |

|
Histogram Spreadsheet |
Reports intensity value distribution for the Red, Green, Blue Color Channels (and the equivalent monochrome intensity histogram). The Spreadsheet Histogram View allows numerical inspection of the intensity value distribution.
|

|
Histogram Table |
Reports the intensity distribution for the Red, Green, Blue Color Channels (and the equivalent gray-level image's monochrome intensity histogram). The Table Histogram View allows numerical inspection of the intensity value distribution. |
Current Display Depth
Image files stored using 12-bits per channel can be displayed using expanded bit-depths via the Current Display Depth drop-down menu. This does not affect the actual data, but can improve the viewing clarity of spreadsheet and histogram data in the display. It also affects the maximum slider value in the contrast dialog, identify dialog, and qualify dialog. The actual bit-depth of captured data can be controlled in Capture Tab.
Image Sub-Sampling
Source Color Channel  See More
The Source Color Channel allows a single component of a color image to be selected for the current view. If combined with the Color Display Mask for All colors, the components can be seen in monochrome.

