The VIS icon is shown in the toolbar.
![]()
The Data Document Playback Toolbar includes buttons to select between Normal, Selected and Group Mode.
Each field is indicated by a folder and is included in the Playback, Export operations, etc.
In this mode, all fields will be rendered in a single 3-D View
Each checked field is included in operations. In this mode all checked fields will be rendered in a single 3-D view
A defined Group Size determines the fields to be included in the 3-D Visualizer.
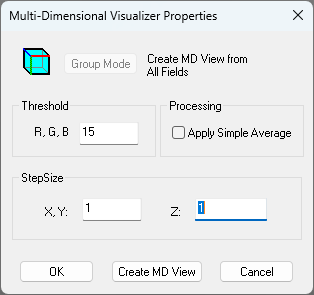
The Multi-Dimensional Visualizer Properties Dialog can be activated from the toolbar icon.

Group Mode has an additional selection in the MD Visualizer Toolbar.

|
Current Group | Create view from All Fields in a Single Group. This can be used to render all slices in a single time point. |

|
All Groups | Create view from All Fields in All Groups. This can be used to render Z-series over time. |

|
Selected Fields | Create view from Selected Fields. |
If the intensity of Red or Green or Blue is greater then the entered threshold value the point will be accepted. The default threshold is 15.
The X,Y Step Size is listed. This is derived from the Data Document Calibration Scale Factor. The Z Step Size is derived from the Z spacing between fields in the Data Document. These values can be modified, but changes will not be reflected back to the Data Document.
This will accept the current settings, exit the dialog and refresh the View if needed.
This will create the Multi-Dimensional View using the settings in the MD Visualizer Properties window.
This will restore the previous settings, exit the dialog and refresh the MD View if needed.