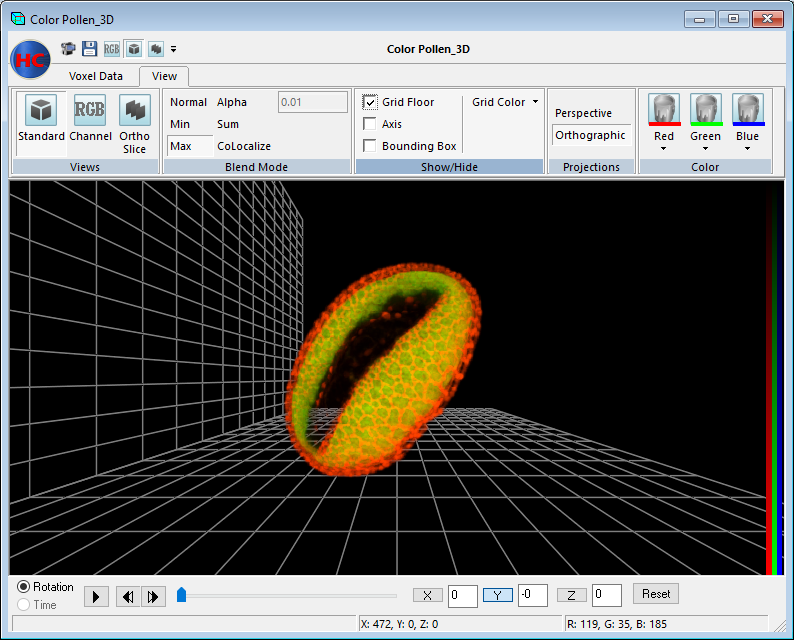
The Visualizer has a new interface, designed for efficiency, the ribbon controls provide quick access to the tools you need. Easily pan and zoom in on areas of interest in large data sets. The Visualizer can reconstruct and render multi-dimensional data sets for interactive 3-D viewing.

Access the Visualizer file menu by clicking on the HC icon. File menu options include saving the rendered image, copying the image to an image document and exporting a movie. The Quick Access toolbar provides easy access to frequently used commands. The toolbar is customizable, command can be added from the File, Voxel Data and View toolbars.
The Voxel Data toolbar is organized to provide quick, easy access to the controls for working with the rendered image.
This feature allows you to specify the subvolume to be rendered. In the edit boxes (X, Y, Z Min and Max) you may specify the first and last slices that should be included in the subvolume's region. A subvolume is also calculated when using the Display Bounding Box, available in the Show/Hide options of the View tab. As the bounding box is manipulated, the X, Y and Z plane Min and Max values also change. Any points within the object that are outside of that range are removed.
Reset Volume - returns the Min and Max to their default values.
Zoom - allows you to control the zoom factor for the image by using the scroll wheel on the mouse. Alternatively, you are able to change the zoom by entering the value the zoom field.
XY is the pixel size determined by the calibration factor calculated in the Calibration window of HCImage. Z is the step size value used during acquisition. The X, Y, and Z values are imported from data documents acquired using HCImage. The known Spatial Calibration values may be manually entered if necessary.
Corrected Aspect Ratio - allows the visible dimensions of the object displayed in the 3-D Visualizer to be adjusted to take into account the pixel spacing in addition to the number of pixels in the X, Y, and Z dimensions.
This feature displays the coordinates used in measuring a distance and defining an Arbitrary Clip Plane.
Arbitrary Points - measure a distance between two points, select Arbitrary Points, press and hold the CTRL button and then left click two points on the object. The coordinates and distance in microns is automatically displayed.
Arbitrary Plane - slice the object (volume) along an arbitrary plane and retain everything above or below the slice and then manipulate the rotation, view and projection of the object. To define an arbitrary plane, select Arbitrary Plane, press and hold the CTRL button and select three points. The sliced section of the object retains it's spatial orientation and is able to be rotated around the object's central position.
Flip - reverse the direction of the cutting plane so that the visible portion of the object becomes the cut portion and vice versa.
View Points - toggle the display of the selected points on/off.
Reset - to erase the display points and clear the coordinates.
The View toolbar is organized to provide easy access to the viewing controls.
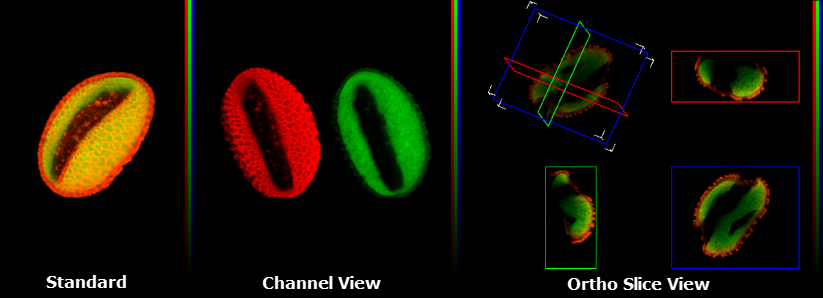
Standard View - displays a single 2-D projection of the 3-D volume.
Channel View - displays a single 2-D projection of the 3-D volume as seen from your perspective for each of the channels captured. Up to three channels are able to be displayed.
Ortho Slice View- displays three single orthogonal planes, oriented to the object’s XY, XZ, ZY perspectives. These planes may be adjusted changing minimum X, Y and/or Z in the volume XYZ control.

This section of the View Menu allows you to specify which 2-D projection will be shown in the 3-D Visualizer.
Normal - displays a single 2-D projection of the 3-D volume as seen from your perspective at the object’s selected orientation.
Min - the minimum projection takes parallel rays, perpendicular to the viewing surface, and casts them through the image. The minimum voxel![]() Is a volume element, representing a value on a grid in 3-dimensional space. This is similar to how a pixel represents 2-D image data. value encountered along each ray is taken for the projection pixel value and the resulting image is made up of each minimum voxel value. The Minimum projection provides volumetric representations in which foreground intensities tend to be suppressed. This projection highlights edges and prominent dim features, and is typically used for viewing brightfield images.
Is a volume element, representing a value on a grid in 3-dimensional space. This is similar to how a pixel represents 2-D image data. value encountered along each ray is taken for the projection pixel value and the resulting image is made up of each minimum voxel value. The Minimum projection provides volumetric representations in which foreground intensities tend to be suppressed. This projection highlights edges and prominent dim features, and is typically used for viewing brightfield images.
Max-the maximum projection takes parallel rays, perpendicular to the viewing surface, and casts them through the image. The maximum voxel value encountered along each ray is taken for the projection pixel value, and the resulting image is made up of each maximum voxel value. This projection highlights edges and prominent bright features, and is typically used for viewing fluorescence images.
Alpha - alpha blend specifies how a pixel's colors should be merged with another pixel when the two are overlaid, one on top of the other. The alpha channel contains a value ranging from 0 to 1. A value of 0 means that the pixel does not have any coverage information and is fully transparent. A value of 1 means that the pixel is fully opaque.
Sum - sum projection takes all the voxel values along each parallel ray, perpendicular to the viewing surface, and sums their intensity values. This creates a projection of all the summed values. Sum Projections provide volumetric representations of the data set in which more information from the data set is considered than with the Maximum projection. Background noise will also be included in this type of projection.
Colocalize - displays only colocalized points.

Grid Floor - displays a grid along the X and Y axes. The grid provides depth perception when zooming in and out.
Axis- displays colored bars on the axes to make it easier to identify the orientation of the object. The X axis is red, the Y axis is green and the Z axis is blue.
Bounding Box - outlines the boundaries of the data set around orthogonal planes, and around subvolume boundaries. This aids in judging the orientation of the dotted line and in judging the relative positions of the planes and the subvolumes.

Perspective - this projection is a 2-D representation of a 3-D object (the data set) as it is perceived by the eye. The object is displayed in a depth perspective so that closer objects appear larger than distant ones.
Orthogonal - this projection is a 2-D representation of an object formed by the perpendicular intersection of lines drawn from points on the object to a plane of projection.
For multi-channel data sets this feature allows the user to select a color map based on a standard group of colors as well as fluorescent dyes for each of the three channels. The color drop-down list is imported from the data document and can be customized using the Customized Contrast Tint List in the Display Contrast Dialog.
The default use of the controls is to scroll through a 360 degree rotation in the X, Y or Z plane. To choose the axis of rotation, click on the X, Y, or Z button and click Play. The data set will begin to rotate around the selected axis and the degree of rotation is displayed. Use the step next button to rotate the data set +10 degrees around the axis. Click the step previous button to rotate -10 degrees around the axis. Manually enter a value and click Enter and the data set will rotate to entered location. The Scroll Bar may also be used to rotate the data set. Click on the desired axis of rotation and then drag the scroll bar to rotate. The degree of rotation is continuously updated as the data set is being rotated. Click the Reset button to return to 0.