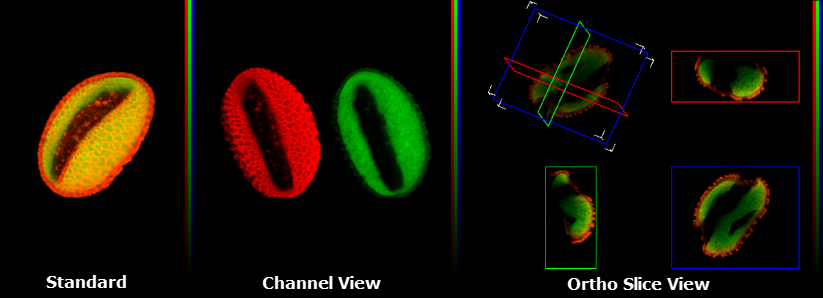
Standard View
This feature displays a single 2-D projection of the 3-D volume.
Channel View
This feature displays a single 2-D projection of the 3-D volume as seen from your perspective for each of the channels captured. Up to three channels are able to be displayed.
Ortho Slice View
This feature displays three single orthogonal planes, oriented to the object’s XY, XZ, ZY perspectives. These planes may be adjusted changing minimum X, Y and/or Z in the volume XYZ control.

This section of the View Menu allows you to specify which 2-D projection will be shown in the 3-D Visualizer.
Normal
This feature displays a single 2-D projection of the 3-D volume as seen from your perspective at the object’s selected orientation.
Minimum Projection
This function takes parallel rays, perpendicular to the viewing surface, and casts them through the image. The minimum voxel![]() Is a volume element, representing a value on a grid in 3-dimensional space. This is similar to how a pixel represents 2-D image data. value encountered along each ray is taken for the projection pixel value and the resulting image is made up of each minimum voxel value. The Minimum projection provides volumetric representations in which foreground intensities tend to be suppressed. This projection highlights edges and prominent dim features, and is typically used for viewing brightfield images.
Is a volume element, representing a value on a grid in 3-dimensional space. This is similar to how a pixel represents 2-D image data. value encountered along each ray is taken for the projection pixel value and the resulting image is made up of each minimum voxel value. The Minimum projection provides volumetric representations in which foreground intensities tend to be suppressed. This projection highlights edges and prominent dim features, and is typically used for viewing brightfield images.
Maximum Projection
This function takes parallel rays, perpendicular to the viewing surface, and casts them through the image. The maximum voxel value encountered along each ray is taken for the projection pixel value, and the resulting image is made up of each maximum voxel value. This projection highlights edges and prominent bright features, and is typically used for viewing fluorescence images.
Alpha Blend
The Red, Green, Blue and Alpha Channels are combined to show translucency.
Sum Projection
This function takes all the voxel values along each parallel ray, perpendicular to the viewing surface, and sums their intensity values. This creates a projection of all the summed values. Sum Projections provide volumetric representations of the data set in which more information from the data set is considered than with the Maximum projection. Background noise will also be included in this type of projection.
Show Colocalized Points
When this function is selected only the colocalized points are displayed.

Display Axis
This feature will display colored bars on the axes to make it easier to identify the orientation of the object. The X axis is red, the Y axis is green and the Z axis is blue.
Display Bounding Box
This feature allows you to outline the boundaries of the data set around orthogonal planes, and around subvolume boundaries. This aids in judging the orientation of the dotted line and in judging the relative positions of the planes and the subvolumes.

Perspective Projection
Is a 2-D representation of a 3-D object (the data set) as it is perceived by the eye. The object is displayed in a depth perspective so that closer objects appear larger than distant ones.
Orthogonal Projection
Is a 2-D representation of an object formed by the perpendicular intersection of lines drawn from points on the object to a plane of projection.